Associated Lab Members

Sadek Nehmeh, Ph.D., is the PET and nuclear physics section chief in the Department of Radiology. In 2000, Dr. Nehmeh began his career as a postdoc and resident fellow in medical physics at the Memorial Sloan Kettering Cancer Center (MSKCC). In 2003, while at MSKCC, he was appointed to assistant physicist; the following year, he was promoted to assistant attending; and in 2009, he was promoted to associate attending. In 2017, Dr. Nehmeh joined the Department of Radiology.
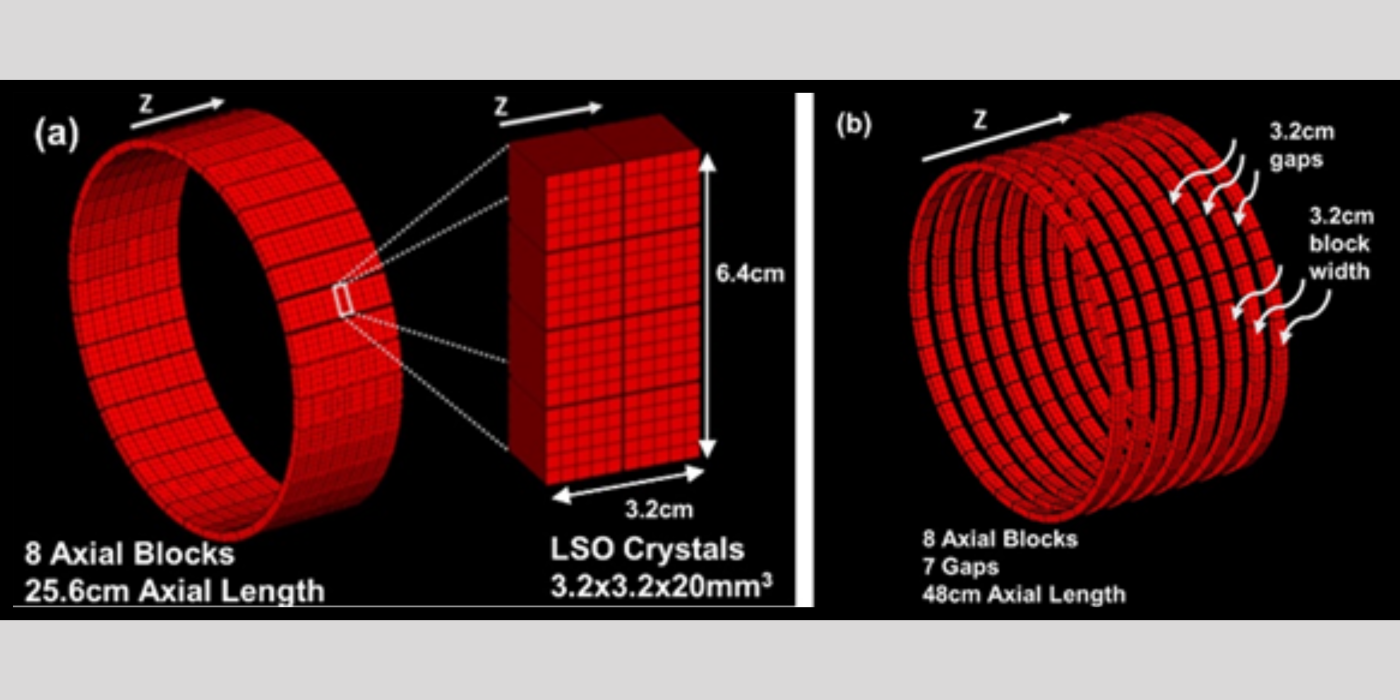
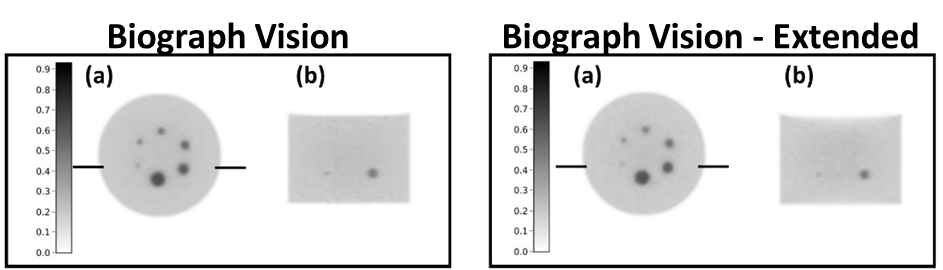
Sadek Nehmeh, Ph.D., has extensive experience in PET physics, clinical PET imaging, and Monte Carlo simulations. His PET physics research focuses on Monte Carlo simulations for novel long axial field-of-view PET systems, application-specific PET systems for noninvasive arterial input function imaging, and Compton scatter PET.
Clinically, Dr. Nehmeh’s research spans hypoxia imaging, simultaneous multi-tracer PET imaging in glioblastoma, PET imaging of multiple sclerosis, cardiac PET imaging, cardiac toxicity in cancer patients, and Alzheimer’s disease. He’s also focused on treatment response assessment in both cancer and neurology.
The author of some 70 publications and book chapters, Dr. Nehmeh has received multiple National Institutes of Health (NIH) grants, industry-sponsored awards, and institutional funding. He also serves as a co-investigator on numerous NIH awards.
Dr. Nehmeh, an active member of the Institute of Electrical and Electronics Engineers, Society of Nuclear Medicine and Molecular Imaging, and American Association of Physicists in Medicine, frequently presents his work at international and national conferences.
He is the director of a WCM medical imaging nuclear physics course, is certified by the American Board of Radiology (ABR), and holds a medical nuclear physics license from the state of New York.
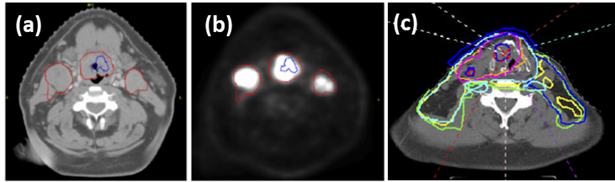
By using 18 fluorodeoxyglucose (F)-labeled fluoromisonidazole (FMISO) PET imaging, Dr. Sadek Nehmeh assessed tumor hypoxia imaging in head-and-neck and lung cancer...
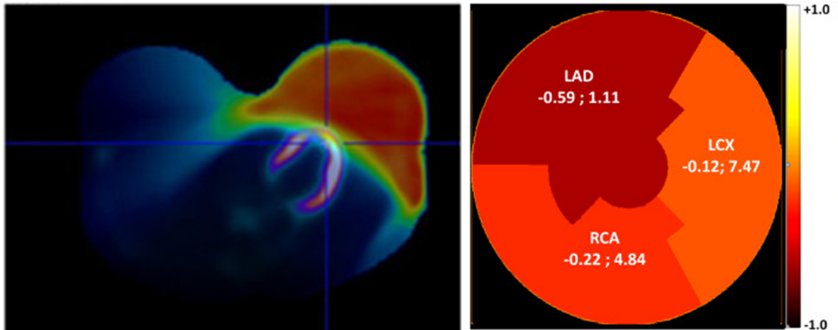
In breast cancer radiotherapy, the mean heart dose is currently 1–5 Gy. Exposures at these levels can cause ischemic heart disease that worsens within five years post-radiation, then continues into the third decade. Determining radiation-induced cardiac toxicity soon after...
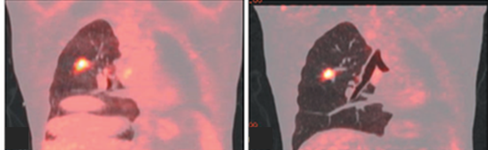
Dr. Sadek Nehmeh’s work in respiratory motion correction in combined positron emission tomography (PET)/computed tomography (CT) images was the first worldwide. He developed multiple methodologies to correct for breathing-induced artifacts, and his work on motion correction in PET/CT was awarded research...
Positron emission tomography (PET) sensitivity and applications (in particular those requiring simultaneous imaging of distant organs) are hindered due to the scanner limited axial field-of-view (AFOV), typically <...